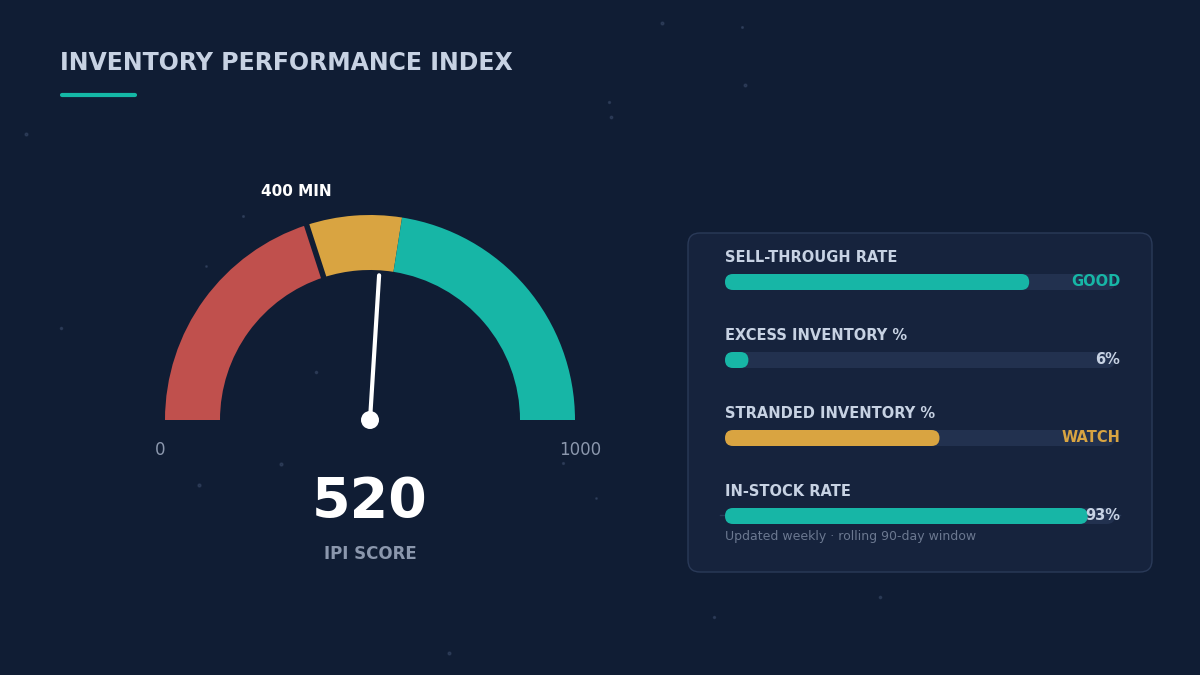
The Inventory Performance Index (IPI) is the 0–1,000 score Amazon assigns to every FBA seller account to measure inventory management discipline — and it's the gatekeeper for how much FBA storage capacity you get. Here's exactly how it's calculated, why it moves slower than you'd expect, and what actually shifts the number.
What IPI Actually Is
IPI isn't a vanity metric — it's the gatekeeper for how much FBA storage capacity you get. Stay above Amazon's minimum threshold, currently 400 (down from 450 in prior years, and Amazon reserves the right to adjust it quarterly based on network-wide capacity), and you get effectively unlimited standard storage, subject to normal fees. Drop below it, and Amazon imposes volume-based storage caps by type — standard, oversize, apparel, footwear — blocks new shipment creation once you hit the cap, and can restrict individual ASINs even if your account still has room elsewhere.
Score bands, based on aggregated seller data and industry benchmarking (not an Amazon-published scale):
| IPI Score | Status | Storage Access | What It Means |
|---|---|---|---|
| 800+ | Optimal | Unlimited | Elite inventory discipline |
| 550–799 | Good standing | Standard capacity | Comfortable operating buffer |
| 400–549 | Adequate | Standard capacity, at risk | No margin for a bad quarter |
| Below 400 | Poor | Restricted | Active storage caps |
| Below 350 | Critical | Severe restrictions | Emergency territory |
IPI Is a Lagging Indicator, Not a Dial You Turn
The single most misunderstood thing about IPI is its time lag. It doesn't respond to quick fixes, and it isn't a real-time control knob — it's a trailing reflection of inventory discipline over rolling weeks and months. Fix your stranded inventory today and that component improves immediately, but sell-through and excess inventory are still calculated against trailing history, so the overall score moves gradually as old data ages out and new data ages in. This is exactly why sellers who scramble right before a quarterly evaluation rarely see the recovery they're hoping for — even correct actions can take several weeks to fully surface in the number. The sellers who consistently sit at 600+ aren't the ones who found a clever trick; they're the ones who treat weekly monitoring, accurate demand forecasting, and fast resolution of stranded inventory as standing operational habits rather than a fire to put out once a quarter.
New Sellers and Update Frequency
If you're a new FBA account, you don't start with an IPI score at all. Amazon doesn't assign one until roughly 15 weeks after your first unit ships into a fulfillment center — it needs real sales and inventory history before it can score you, and until then you're not held to the threshold. Once assigned, the score updates weekly, typically Tuesday mornings Pacific Time. But because it's calculated from rolling historical windows, not real-time snapshots, this week's number reflects weeks of past behavior — a single good or bad week barely moves it.
How the Score Is Actually Computed
Amazon has stated directly to sellers that the calculation is proprietary and won't be published — the same stance it takes on the Buy Box algorithm. What Amazon does confirm are the four input metrics, and three of them have documented formulas:
Sell-through rate = units sold (trailing ~90 days) ÷ average units in stock (same period). A rate of 3.0 means you sold 3x your average on-hand inventory over the window — roughly what you'd get selling 300 units while averaging 100 in stock. Benchmarks vary by source, but 3.0+ is generally treated as acceptable, 4–5 as good, 6+ as excellent.
Excess inventory % — a SKU gets flagged once Amazon's forecast says your current stock will take more than 90 days to sell through at current velocity. If you're holding 1,000 units and Amazon forecasts 100 units of demand over the next 90 days, 900 units (90%) are flagged excess. This recalculates weekly against Amazon's own demand model, which you can't see directly.
Stranded inventory % — the share of on-hand units with no active, sellable listing: suppressed listings, policy violations, missing attributes, expired category approvals, IP complaints, or catalog errors. These units sit in a fulfillment center, accrue storage fees, and generate zero revenue.
In-stock rate — the percentage of days your replenishable best-sellers (products with sales in ~30 of the last 60 days) were actually available to buy.
Estimated relative weighting, per industry analysis of score movement across thousands of seller accounts — again, Amazon has not confirmed these percentages:
- Excess inventory: ~40–45%
- Sell-through rate: ~30–35%
- Stranded inventory: ~15–20%
- In-stock rate: ~10–15%
If that weighting is roughly right, it means excess inventory and sell-through dominate the score, while stranded inventory — the factor most directly tied to prep quality — is a smaller but still meaningful slice, and one of the fastest to fix.
Worked Example: How One Prep Failure Drags Down Three Metrics at Once
This is illustrative math, not Amazon's actual formula, but it shows the mechanism clearly.
Take an established seller — well past the 15-week new-account window — running 40 active FBA SKUs moving roughly 4,000 units/month, with a score that's historically held around 520. A supplier packaging change causes 6 SKUs to arrive with incorrect FNSKU placement over a few weeks. Here's what happens, factor by factor:
- Those 6 SKUs get flagged on receipt → stranded inventory % jumps from under 2% of the account to roughly 15% of the affected SKUs' units
- While stranded, those units aren't selling → in-stock rate on those exact SKUs drops toward zero
- Replacement stock rushed in to cover the gap now sits alongside the stranded units, since the originals haven't been resolved yet → excess inventory % ticks up too, because Amazon's forecast hasn't caught up to the temporary oversupply
Three of the four inputs move in the wrong direction from a single root cause. Given the estimated weighting above (stranded ~15–20%, excess ~40–45%), even a modest hit to both can plausibly pull a score from the 520 range down toward 400 or below within a few weekly updates — while sell-through on the other 34 SKUs never changed. That's the actual mechanism: IPI punishes correlated failures more than isolated ones, because prep and labeling problems tend to cascade across multiple factors simultaneously rather than staying contained to one.
Amazon's Operational Angle for IPI
Most seller-facing content stops at "IPI controls your storage cap." There's a mirrored cost on Amazon's side that explains why IPI is built this aggressively — this is operational reasoning based on how FC receiving, stow, and pick actually work, not a published Amazon figure.
Amazon's fulfillment centers run on random/chaotic stow — inventory sits wherever there's open bin space, tracked by barcode and location ID, a system built around constant turnover. A slow-moving or stranded unit doesn't sit passively: it occupies a bin a faster-turning SKU could otherwise use, for weeks or months, while contributing nothing to throughput. That has two real costs for Amazon. Space economics — every cubic foot tied up in dead stock is a cubic foot Amazon can't allocate to inventory that will actually ship, which is exactly the dynamic behind Amazon's steep long-term storage surcharges (documented tiers run roughly $0.87/cubic foot at 181–365 days up to $6.90/cubic foot past 365 days) and its push toward AWD as a cheaper holding tier for slow stock. Labor economics — a bin was stowed once at real labor cost, and a unit that never gets picked never earns that cost back. At Amazon's scale, low-turn inventory across the seller base is a real drag on pod efficiency and cost-per-pick, even at a small percentage.
IPI isn't punitive — it's Amazon using storage access as the lever to keep the physical network running the way it's engineered to run.
What Actually Moves the Score — and What Doesn't
Works:
- Fixing stranded inventory within 24–48 hours of it appearing (check the "Fix Stranded Inventory" report weekly — this is the fastest, cheapest lever you have)
- Sending smaller, more frequent replenishment shipments instead of large infrequent ones — this smooths average on-hand inventory and directly improves sell-through
- Increasing sales velocity on slow SKUs through promotions, PPC, or pricing before Amazon flags them as excess (i.e., acting at 60–75 days of supply, not waiting for the 90-day flag)
- Removing genuinely dead inventory (zero sales in 90+ days) rather than letting it accrue long-term storage surcharges while dragging the score
Doesn't work:
- Removing small amounts of slow-moving stock hoping for a visible score bump — negligible unless it's a meaningful share of total excess units
- Shipping inventory in and immediately removing it to "increase turnover" — IPI measures units sold to customers, not units cycled through the warehouse
- Short-term discount spikes to juice sell-through right before an evaluation — a few days of elevated sales barely moves a 90-day trailing average
- Marking items non-replenishable, hoping it helps — it has no documented effect on IPI
Emergency Recovery, If You're Already Below Threshold
Realistic expectations matter here: if you're at 380 with an evaluation two weeks out, you will not reach 550. The goal in an emergency window is demonstrable improvement, not a full recovery — Amazon's evaluation looks at trend as much as absolute level.
| Days | Action |
|---|---|
| 1–2 | Fix all stranded inventory immediately |
| 3–4 | Create removal orders for anything at 120+ days of supply |
| 5–6 | Launch promotions/discounts on anything at 90+ days of supply |
| 7 | Submit Lightning Deal requests for aged inventory (allow 4–6 weeks for approval in non-emergency cases) |
| 8–14 | Monitor weekly updates, adjust based on what's actually moving |
Sellers who consistently sit above 600 rarely need this protocol — the entire point of managing IPI proactively is to never be in emergency mode heading into Q4.
Where Prep Quality Fits In
Stranded inventory is the one IPI factor most directly caused by operational execution rather than demand forecasting — a mislabeled FNSKU, incorrect polybagging, a missing suffocation warning, or a pallet that gets flagged and pulled from the receive queue. Given the worked example above, a single prep failure doesn't just cost you the stranded-inventory hit — it can ripple into excess and in-stock rate too, compounding a score drop from one root cause. At PrepMeisters, every shipment is prepped to Amazon's current spec before it reaches a fulfillment center — correct FNSKU placement, compliant labeling, and pallet builds that are received error-free the first time — specifically to keep prep-driven errors off your IPI scorecard. If storage limits are constraining your growth heading into peak season, get a free quote and let's look at where prep execution might be quietly working against your score.
Ready to Get Started?
Let PrepMeisters handle your Amazon FBA prep with the expertise that comes from a decade inside Amazon. 100% compliant prep, every time.
Get a Free Quote